Logger
#include "Logger/Logger.h"
The OmniSci Logger is based on Boost.Log with a design goal of being largely, though not completely, backward compatible with glog in usage, but with additional control over the logging format and other features.
For the database user, log settings are set in the same manner as other program options, which can be specified via the command line or config file. These include settings such as the directory where log files are written to, log file naming format, log severity level, etc. See Program Options.
For the developer, log entries are made in a syntax that is similar to std::ostream. Example:
LOG(INFO) << "x = " << x;
where INFO is one common example of the log “severity” level. Other severities are WARNING, FATAL,
DEBUG1, etc. See Severity.
In addition, there are a number of CHECK macros which act like assert() but will report via the
logging system upon failure, with an optional message, and subsequently call abort(). Examples:
CHECK(ptr);
CHECK_LT(1u, list.size()) << "list must contain more than 1 element.";
If ptr==nullptr or 1u >= list.size() then the program will abort, and log a corresponding FATAL message.
See CHECK.
Program Options
omnisci_server --help includes the logging options:
Logging:
--log-directory arg (="mapd_log")     Logging directory. May be relative to
                                      data directory, or absolute.
--log-file-name arg (=omnisci_server.{SEVERITY}.%Y%m%d-%H%M%S.log)
                                      Log file name relative to
                                      log-directory.
--log-symlink arg (=omnisci_server.{SEVERITY})
                                      Symlink to active log.
--log-severity arg (=INFO)            Log to file severity level: INFO
                                      WARNING ERROR FATAL
--log-severity-clog arg (=ERROR)      Log to console severity level: INFO
                                      WARNING ERROR FATAL
--log-channels arg                    Log channel debug info: IR PTX ASM
--log-auto-flush arg (=1)              Flush logging buffer to file after each
                                      message.
--log-max-files arg (=100)             Maximum number of log files to keep.
--log-min-free-space arg (=20971520)  Minimum number of bytes left on device
                                      before oldest log files are deleted.
--log-rotate-daily arg (=1)           Start new log files at midnight.
--log-rotation-size arg (=10485760)   Maximum file size in bytes before new
                                      log files are started.
The class logger::LogOptions manages the above values, and integrates into the Boost.Program_options
classes used by the OmniSciDB to process program options, from both the command line and/or a config file.
Initialization and Global Instances
To initialize the logging system, the function:
namespace logger {

void init(LogOptions const&);

}
must be invoked with the logger::LogOptions object to be applied. It is recommended to run this from
main() as early as possible. This initializes two global logging objects, gChannelLogger and
gSeverityLogger, that exist in the object file Logger.o, which should never be referenced
directly. Instead, use the LOG/CHECK macros for all normal logging. This is mentioned here so that
issues such as global variable construction/destruction can be considered. More specifically, due to the
unpredictability of static initialization order fiasco, logging should never be done from other global
constructors or destructors, directly or indirectly.
Usage
Severity
There are currently 8 severity levels that can be used with the LOG() macro, in decreasing order of
severity from most severe to least:
Severity |
When to Use |
|
An unrecoverable error has occurred, and must be fixed in the software.
This is the only severity which will result in a call to |
|
A recoverable error has occurred, and must be fixed in the software. |
|
Something that “should not have” happened happened, but is not as demanding
of an immediate fix as an |
|
Significant and informative milestones in the execution of the program. One must balance logging useful and informative information, against logging too much useless and redundant information that drowns the signal out with noise. |
|
More detailed information about the execution of the program than |
|
More detailed information than |
|
More detailed information than |
|
More detailed information than |
The program option --log-severity is set to exactly one of these, defaulting to INFO. All LOG()
calls with a lesser severity are ignored and not logged. For example if --log-severity=DEBUG1 then log
calls LOG(DEBUG1), LOG(INFO), LOG(WARNING), LOG(ERROR), and LOG(FATAL) are active and
will produce log entries when executed, and log calls LOG(DEBUG4), LOG(DEBUG3), and LOG(DEBUG2)
are ignored. If a function is called in the input stream, e.g. LOG(DEBUG2) << f(x), then f(x) will
be invoked if any only if DEBUG2 is an active log severity.
One guiding principle for deciding which of the debug levels to use is to consider it from the perspective of
someone who is trying to diagnose/debug a problem. Running the database with --log-severity=DEBUG4 will
show ALL debug log lines, but more information must be searched through in order to find what is useful. Having
a few different debug levels allows for some control over how verbose the logging is.
Errors that are logged with ERROR and FATAL should be considered software errors, and not user errors.
For example, if the user inputs a malformed SQL query, e.g. SELEKT instead of SELECT, then this
should NOT be logged as an ERROR, but instead logged as an INFO with an appropriate response to
the user. This would be considered correct behavior of the software. In contrast, anytime an ERROR or
FATAL is logged, then it means there is a bug in the software that must be fixed.
For backward compatibility, the flag --verbose=on is equivalent to --log-severity=DEBUG1. If both
are provided, then the lesser severity is active.
Log Files
A separate log file is produced for INFO, WARNING, ERROR, and FATAL if the log severity is
active. If any of the DEBUG severities are active, they are included into the INFO log file. Each log
file redundantly includes all entries that are more severe than itself. For example if --log-severity=DEBUG1
then the INFO log file will include all log calls LOG(DEBUG1), LOG(INFO), LOG(WARNING),
LOG(ERROR), and LOG(FATAL); the WARNING log file will include all log calls LOG(WARNING),
LOG(ERROR), and LOG(FATAL).
The name of the log file by default includes the program name, severity, and timestamp of when its first entry was made. Example:
omnisci_server.INFO.20190918-162525.log
This can be customized with the --log-file-name program option.
New log files are started on each (re)start. A symbolic link without the timestamp and file extension suffix points to the latest version. Example:
omnisci_server.INFO -> omnisci_server.INFO.20190918-162525.log
Format
The general format of a log entry is:
(timestamp) (severity) (process_id) (query_id) (thread_id) (filename:line_number) (message)
Example:
2019-09-18T16:25:25.659248 I 26481 5 DBHandler.cpp:181 OmniSci Server 4.9.0dev-20190918-bd97353685
Field descriptions:
F E W I 1 2 3 4I implies that the above log entry is of INFO severity.LOG() via the insertion << operator.Note that log entries can contain line breaks, thus not all log lines will begin with these fields if the message itself contains multiple lines.
Channel
Channels are similar to severities, but exist outside of the severity hierarchy, have no ordering of their own,
and can only be activated by explicitly including them in the --log-channels program option.
Currently there are 3 channels: IR PTX ASM
which log intermediate representation, and parallel thread execution code, respectively. Scripts may be
used for other purposes that parse and analyze these logs, therefore using channels outside of the severity
hierarchy is convenient so that the output is not interleaved with unrelated INFO or DEBUG log lines.
For example, LOG(IR) << "Foo = " << foo.getIr(); will be activated if any only if IR is included
in the --log-channels program option, which can accept multiple comma-delimited channel names. If activated,
the output will be logged to a file named after the channel, e.g. omnisci_server.IR.20190918-162525.log.
Macros
LOG
In addition to the LOG() macro, there are:
LOG_IF(severity, condition)- Same asLOG(severity)but first checks a booleanconditionand logs only if evaluated totrue.
VLOG(n)- Same asLOG(DEBUGn)forn = 1, 2, 3, 4.
CHECK
The CHECK(condition) macro evaluates condition as a boolean value. If true, then execution continues
with nothing logged. Otherwise both the condition source code string is logged at FATAL severity,
along with any optional << message, before calling abort(). The program may then either exit, or
optionally catch the SIGABRT signal.
CHECK comparison macros:CHECK_EQ, CHECK_NE, CHECK_LT, CHECK_LE, CHECK_GT, CHECK_GE==, !=, <, <=, >, >=, respectively. For example, CHECK_LT(1u, list.size()) will evaluate 1u < list.size(), and log and abort() if not true. The advantage of calling CHECK_LT(1u, list.size()) over CHECK(1u < list.size()) is that the value of both operands will be logged if the test fails, which is not reported with CHECK().STDLOG
DBHandler uses a logging helper class StdLog for logging query-specific information in
a standard format:
(timestamp) (severity) (process_id) (query_id) (thread_id) (filename:line_number) stdlog (function_name) (match_id)
(time_ms) (username) (dbname) (public_session_id) (array of names) (array of values)
Since this contains timing information, it is logged at the end of query execution. If the DEBUG1 severity is
active, then a corresponding stdlog_begin line is also logged at the start of the query, with the same format.
Example usage is given in the QueryState documentation.
Example entries:
2019-09-20T17:15:28.215590 1 13080 DBHandler.cpp:846 stdlog_begin sql_execute 2 0 omnisci testuser 528-dyM2 {"query_str"} {"SELECT * FROM omnisci_counties LIMIT 1;"}
2019-09-20T17:15:28.924512 I 13080 DBHandler.cpp:846 stdlog sql_execute 2 709 omnisci testuser 528-dyM2 {"query_str","execution_time_ms","total_time_ms"} {"SELECT * FROM omnisci_counties LIMIT 1;","708","709"}
The first 4 fields are same as in the above Format section. Additional field descriptions:
stdlog_begin/stdlog- logged whenStdLogobject is constructed/destructed.function_name- Name of function theStdLogobject was constructed/destructed in.match_id- Integer to uniquely matchstdlog_beginandstdloglines together.time_ms- Time in milliseconds since constructor. Forstdlog_beginit is always 0. Forstdlogit is the time between the constructor and destructor, which is generally the duration of the function call.username- Session username. Blank if not available.dbname- Session database. Blank if not available.public_session_id- Identifier for session. May be publicly accessible without compromising security. Blank if not available.names- List of optional value names in SQL-array format.values- List of optional values in SQL-array format, in same order asnames. Names and values are logged in this way so as to be readily imported into a SQL table for analysis.
DEBUG_TIMER
DebugTimer objects can be instantiated in the code that measure and log the duration of their own lifetimes,
and include the following features:
Globally accessible via a macro. E.g.
auto timer = DEBUG_TIMER(__func__).Single multi-line log entry is reported for nested timers.
Enabled with the
--enable-debug-timerprogram option. Without it, thetimerobjects have no effect.Include timers from spawned threads. Requires a call on the child thread informing the parent thread id:
DEBUG_TIMER_NEW_THREAD(parent_thread_id);
Example:
void foo() {
  auto timer = DEBUG_TIMER(__func__);
  ...
  bar();
  ...
}

void bar() {
  auto timer = DEBUG_TIMER(__func__);
  ...
  bar2();
  ...
  timer.stop();  // Manually stop timer for bar().
  ...
}

void bar2() {
  auto timer = DEBUG_TIMER(__func__);
  ...
}
Upon the destruction of the timer object within foo(), a log entry similar to the following will be made:
2019-10-17T15:22:53.981002 I 8980 foobar.cpp:70 DEBUG_TIMER thread_id(140719710320384)
19ms total duration for foo
  17ms start(10ms) bar foobar.cpp:100
    13ms start(10ms) bar2 foobar.cpp:130
Fields for the Duration lines (last two line above) are:
Lifetime of
timerobject.Time after start of current thread. (This can be used to find gaps in timing coverage.)
String parameter to
DEBUG_TIMER(__func__in above examples.)File:Line where
DEBUG_TIMERwas called from.
The first root DEBUG_TIMER instance is in foo(), and the two others in bar() and bar2() are initiated
upon subsequent calls into the call stack, represented by the indentations. Once the first root timer object
destructs, the entire DurationTree of recorded times are logged together into a single multi-line log entry,
one line per timer instance.
There is a DebugTimer::stop() method that manually stops the timer, serving the same function
as the destructor. The destructor then will have no further effect.
To embed timers in a spawned child thread, call DEBUG_TIMER_NEW_THREAD(parent_thread_id); from the child
thread. The parent_thread_id must get its value from logger::thread_id() before the new thread is spawned.
This will not start a timer, but will record the child-parent relationship so that subsequent DEBUG_TIMER
calls are stored in the correct node of the parent tree. An example of a resulting report:
2020-01-30T16:58:19.926148 I 33266 DBHandler.cpp:956 DEBUG_TIMER thread_id(4)
591ms total duration for sql_execute
  511ms start(41ms) executeRelAlgQuery RelAlgExecutor.cpp:71
    6ms start(41ms) executeWorkUnit RelAlgExecutor.cpp:1858
      4ms start(41ms) compileWorkUnit NativeCodegen.cpp:1571
        New thread(5)
          0ms start(0ms) fetchChunks Execute.cpp:2024
          0ms start(0ms) getQueryExecutionContext QueryMemoryDescriptor.cpp:711
          0ms start(0ms) executePlanWithoutGroupBy Execute.cpp:2276
            0ms start(0ms) launchGpuCode QueryExecutionContext.cpp:195
        End thread(5)
Note
Any timer that is created in a thread when no other timers are active in the same or parent thread is
called a root timer. The timer stack is logged when the root timer destructs, or stop() is called,
after which memory used for tracking the timer trees are freed. The performance cost of this should be
kept in mind when placing timers within the code.
Warning
Non-root timers that end after their root timer ends will result in a segmentation fault (but only
when the --enable-debug-timer option is active). This is easily avoided by not interleaving timer
lifetimes with one another in the same block of code, and making sure that all child threads end prior
to the ending of any corresponding root timer.
The high-level class relationships are:
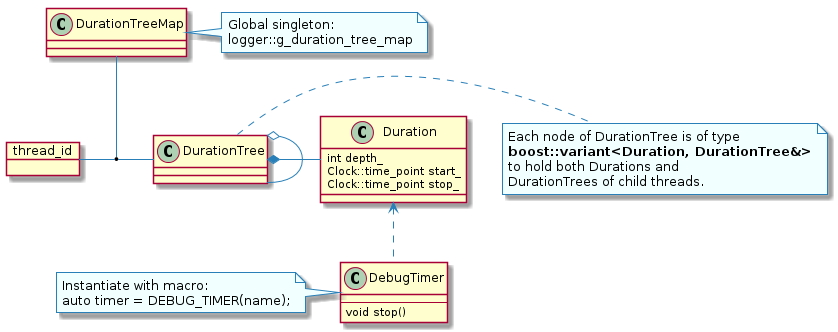
There is a single global instance of DurationTreeMap that tracks a separate DurationTree for each thread.